| Click Here for PDF Copy which includes a list of exported fields that are in each report. |
| Report name |
Report View (click image) |
Export Headings |
Report Description |
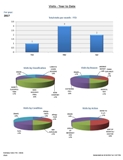
Visits – Year to Date |
KHA
|
Visit date
Classification
Reason 1
Condition 1
Treatment 1
Action 1
Managing Staff
Staff
Department
Group
Key |
Report automatically pulls statistics in Chart from Jan 1 of current year to current date.
- Main sheet: Bar chart of number of visits by month, pie chart of percentage of those visits by classification. Pie chart of percentage of those visits by reason. Pie chart of percentage of those visits by condition. Pie chart of percentage of those visits by action. Bar chart of # of visits by Managing staff.
- Sheet 2: Table of number of visits by dept/group by month.
- Sheet 3: Table of number of visits by managing staff by month.
- Sheet 4: Table of visit details including classification, reason, condition, treatment and action and totals by managing staff.
|
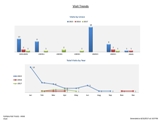
Visit Trends |
KHB
|
Visit date
Visit time
Union
Position
Dept Group
No active employees in dept group
Managing Staff
Staff
Classification
Key |
Pull report by visit date range.
- Main sheet: Chart of number of visits by classification and year. Chart of number of visits by managing staff by year. Chart of visits by union by year. Line graph of total visits by year. Line graph of time trend for all years total.
- Sheet 2: Detailed table of dept/group, # of employees, classification and total number of visits by year.
- Sheet 3: Number of visits by department and year.
- Sheet 4: Number of visits by position and year.
- Sheet 5: Number of visits by classification and year.
|
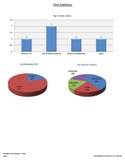
Visit Statistics |
KHC
|
Visit date
Classification
Reason
Condition
Treatment
Action
Position
Union
Managing Staff
Staff
Dept Group
Key |
Pull report by visit date range.
- Main sheet: Includes bar charts of top ten visits by condition, reason, treatments and actions taken. Pie chart of percentage top managing staff and top position visits.
- Sheet 2: Table of all action numbers by year.
- Sheet 3: Table of all treatment numbers by year.
- Sheet 4: Table of all classification numbers by year.
- Sheet 5: Table of managing staff and classification numbers over time period.
- Sheet 6: Table of dept/groups visits, reason for visits and number of those visits.
|
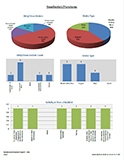
| Needlestick / Punctures |
KHD
|
Emp ID
Last Name First Name
Chart Date
Position
Dept Group
Dept Description
Classification
Reason
Managing Staff
Staff
Condition
Treatment
Action
Union
Job Category
Other Job
Where
Where other
Department Code
Department
Source PatientIdentifiable
Employee Trained
Injured Emp Orig User
Sharp Item
Sharp Purpose
Other Purpose
Did Injury Occur
Other Injury Occur
Device Type
Needle Surgical Glass
Other Item
Brand Manufacturer
Model
Safety Designed
Safety Activated
Exposure
Employee Key
Year End
|
Report of needlestick data recorded in Chart.
- Main Sheet: Pie charts of clean/dirty and device type. Bar chart of dirty or clean, bar chart of device type, bar chart of activity during incident. Bar charts of needlestick/punctures by year, whether instrument included safety design, whether safety was activated, time of exposure and whether employee was trained in its use.
- Sheet 2: Table of employee position and counts of incidents by year.
- Sheet 3: Table of incidents by year and whether instrument was safety designed.
- Sheet 4: Table of incidents by department/group. Includes name, chart date, where inc. occurred, the sharp item used, the purpose of item, action taken and counts.
|
| Blood and Body Fluid |
KHE
|
Emp ID
Last Name First Name
Chart Date
Position
Dept Group
Dept Description
Classification
Reason
Managing Staff
Staff
Condition
Treatment
Action
Union
Date of Exposure
Date of Exposure
Dept Code
Department desc
Job Category
Where
Source patient Identifiable
Body Fluid
Other
Contaminated with blood
Employee Key
Year End
|
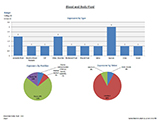
Report of blood and body fluid data recorded in Chart.
- Main Sheet: Bar chart of BBF exposures by type. Pie chart of BBF exposures by position and by union.
- Sheet 2: Table counts of body fluid types by year.
- Sheet 3: Table by department/group. Includes body fluid type by year.
- Sheet 4: Table by department/group. Includes date of BBF exposure, name, chart class, job category, chart date, body fluid and counts.
- Sheet 5: Table by managing staff. Includes date of exposure, class, name, job category, chart date, body fluid and whether the source patient is known.
- Sheet 6: Table by job category. Includes date of exposure, name, chart date, managing staff name, body fluid, whether the source patient is known and totals.
|
| Comment Activity Report |
KHF
|
Emp ID
Last Name First Name
Chart Date
Chart Time
Position
Dept Group
Dept Description
Union
Classification
Reason 1
Reason 2
Managing Staff
Staff
Contact
Condition 1
Condition 2
Condition 3
Condition 4
Treatment 1
Treatment 2
Treatment 3
Treatment 4
Action 1
Action 2
Action 3
Date of Comment
Time of Comment
Type of Comment
Username
Date Comment Entered
Employee Key
Year End
|
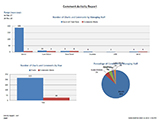
Activity report can be pulled by chart date or date of chart entry.
- Main sheet: Bar chart of number of charts created by managing staff and number of comments made. Bar chart of # of charts created and # of comments made in date range. Pie chart of percentage of comments made by managing staff. Data is displayed by Chart Date range.
- Sheet 2: Bar chart of number of comments (confidential and general) made by managing staff. Percentage of comments made by managing staff. Comments totals by confidential and general in range. Data is displayed by Chart Date range.
- Sheet 3: Table of comment counts sorted by managing staff. Includes date comment entered, date of comment, class of chart, reason, condition and counts of general and confidential comments made.
- Sheet 4: Table of comment counts sorted by managing staff. Includes date of chart, name, classification of chart, date of comment and count of general and confidential comments made.
|