| Click Here for PDF Copy which includes a list of exported fields that are in each report. |
| Report name |
Report View (click image) |
Export Headings |
Report Description |
Audiometric Results |
NHA
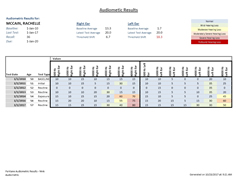
|
Test Date
Test Type
Last Name First Name
Department
1000 Test Left
500 Hz Left
1000 Hz Left
2000 Hz Left
3000 Hz Left
4000 Hz Left
6000 Hz Left
8000 Hz Left
Average Left
1000 Test Right
500 Hz Right
1000 Hz Right
2000 Hz Right
3000 Hz Right
4000 Hz Right
6000 Hz Right
8000 Hz Right
Average Right
Category
Hearing Trend
Recall Months
Test Type
Date of Birth.
Age
Key
|
Report pulls all entries for one employee.
- Main sheet: in table format, all dB results by frequency for right and left ear. Includes next due date and threshold shifts for average 2, 3, 4, left and right. Hearing loss is colour coded for each entry.
- Sheet 2: in table format, all dB results by frequency for right and left ear. Includes next due date and threshold shifts for average 2, 3, 4, left and right. No colour coding.
- Sheet 3: Table of all right ear results by frequency, dB over 25 are bold red. Includes threshold shift and due date.
- Sheet 4: Table of all left ear results by frequency, dB over 25 are bold red. Includes threshold shift and due date.
|
Hearing Loss |
NHB
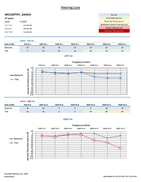
|
Test Date
Test Type
Last Name First Name
Department Group
1000 Test Left
500 Hz Left
1000 Hz Left
2000 Hz Left
3000 Hz Left
4000 Hz Left
6000 Hz Left
8000 Hz Left
Average Left
1000 Test Right
500 Hz Right
1000 Hz Right
2000 Hz Right
3000 Hz Right
4000 Hz Right
6000 Hz Right
8000 Hz Right
Average Right
Category
Hearing Trend
Recall Months
Test Type
Date of Birth.
Age
Key
|
Report is pulled by employee and includes: most recent audiometric results and baseline.
- Main sheet: Table of left ear results and left ear audiogram. Table of right ear results and right ear audiogram. Colour coded hearing by hearing loss severity. Includes next test due date.
|
Trends Report |
NHC
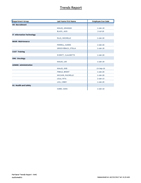
|
BaseLine Date
Test Date
Last Name First Name
Department Group
Average Left
Average Right
Average Baseline Left
Average Baseline Right
Threshhold Shift Left
Threshhold Shift Right
Occupation
Recall Months
Date of Birth.
Age
Key
Due Date
|
Pull report by department or group and date range. Displays most recent test within date range.
- Main sheet: Table of right ear average baseline, average test results, and average threshold shift by occupation.
- Sheet 2: Table of left ear average baseline, average test results, and average threshold shift by occupation.
- Sheet 3: Table right ear average test results, average threshold shift by department/group. Includes # of employees tested.
- Sheet 4: Table left ear average test results, average threshold shift by department/group. Includes # of employees tested.
- Sheet 5: Table of department, employee name and due date.
|
Audiogram |
NHD
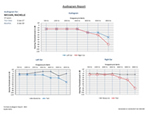
|
Test Date
Test Type
Last Name First Name
Department
Frequency
Left
Right
Date of Birth.
Age
Key
|
Pull by employee and test date for comparison to baseline.
- Main sheet: Audiogram graphs. Right and left ear graph, left ear/baseline graph and right ear/baseline graph.
- Second sheet: Table of right and left ear results by frequency, including baseline. Displays averages and threshold shifts.
|